FLCharts: Create Bar Chart easily
Create beautiful and highly customisable bar, line, radar charts and many more with FLCharts, a flexible, easy-to-use library.
• 3 min read
Availability
iOS 11.0
FLCharts is a flexible, easy-to-use third-party library, allowing you to highly customise your chart.
FLCharts is an easy-to-use library to build highly customizable bar charts. It allows you to create your own chart bar.
Here I used some gas consumptions data to demonstrate how to set up a basic bar chart using FLCharts.
Install
You can install FLCharts through Cocoapods or Swift Package Manager.
Setting Up a Chart View
Firstly, make sure to import FLCharts to the top of the file.
import FLCharts
Setting Up Data
let monthsData = [MultiPlotable(name: "jan", values: [30]),
                  MultiPlotable(name: "feb", values: [55]),
                  MultiPlotable(name: "mar", values: [70]),
                  MultiPlotable(name: "apr", values: [45, 30]),
                  MultiPlotable(name: "may", values: [85]),
                  MultiPlotable(name: "jun", values: [46, 40]),
                  MultiPlotable(name: "jul", values: [75]),
                  MultiPlotable(name: "aug", values: [10]),
                  MultiPlotable(name: "set", values: [60]),
                  MultiPlotable(name: "oct", values: [75]),
                  MultiPlotable(name: "nov", values: [85]),
                  MultiPlotable(name: "dec", values: [55, 50, 20])]
Each MultiPlotable object represents the data of one month. The name value is the name of the month on the x axis and the values property is their consumptions on the y axis.
let chartData = FLChartData(title: "Consumptions",
                            data: monthsData,
                            legendKeys: [Key(key: "F1", color: .Gradient.purpleCyan),
                                         Key(key: "F2", color: .green),
                                         Key(key: "F3", color: .Gradient.sunset)],
                            unitOfMeasure: "kWh")
Here, we are setting up the data for the chart.
FLChartData contains all the data the chart needs to configure itself.
The title is shown when the chart is embedded in a FLCard.
The legendKeys define the color of the sections of the bar and the keys of the legend, if it is embedded in a FLCard.
FLCharts has a collection of colors and gradients to use in your chart. And you can create your own using the FLColor struct.
Creating chart
Then we create the actual chart with this simple line of code.
let chart = FLChart(data: chartData, type: .bar())
Tip
The bar chart allows you to create your own bar view simply creating a class that conforms to ChartBar protocol.
Now we have to layout the chart, in this example we will do it using AutoLayout.
view.addSubview(chart)
chart.translatesAutoresizingMaskIntoConstraints = false
NSLayoutConstraint.activate([
    chart.centerYAnchor.constraint(equalTo: view.centerYAnchor),
    chart.centerXAnchor.constraint(equalTo: view.centerXAnchor),
    chart.heightAnchor.constraint(equalToConstant: 300),
    chart.widthAnchor.constraint(equalToConstant: 330)
])
And here is our bar chart.
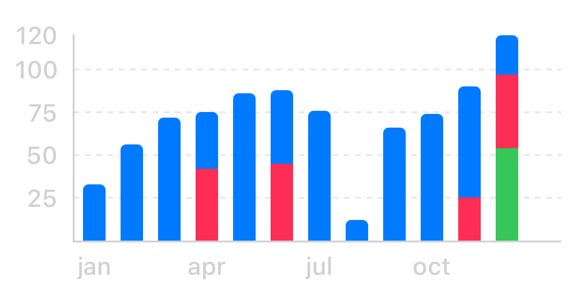
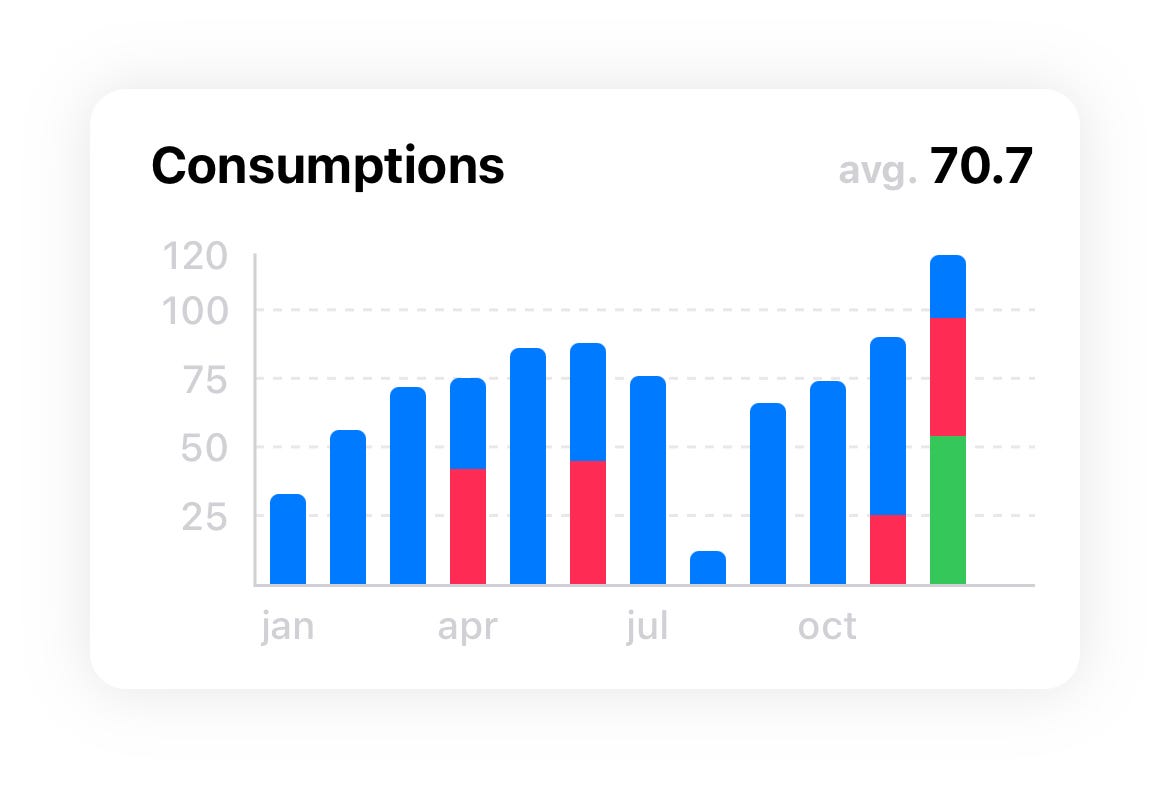
Embed chart inside FLCard
Now, we can embed the chart inside a card.
let card = FLCard(chart: chart, style: .rounded)
card.showAverage = true
card.showLegend = false
This is all we need for this task.
As you may notice FLCard has some additional properties and the ability to customize the card itself through the style property.
FLCharts has two predefined styles: .plain and .rounded, but you can create your own using the FLCardStyle struct.
There is just one last thing to change in order to show the card. We must replace chart with card in the auto layout code.
view.addSubview(card)
card.translatesAutoresizingMaskIntoConstraints = false
NSLayoutConstraint.activate([
    card.centerYAnchor.constraint(equalTo: view.centerYAnchor),
    card.centerXAnchor.constraint(equalTo: view.centerXAnchor),
    card.heightAnchor.constraint(equalToConstant: 300),
    card.widthAnchor.constraint(equalToConstant: 330)
])
Final result
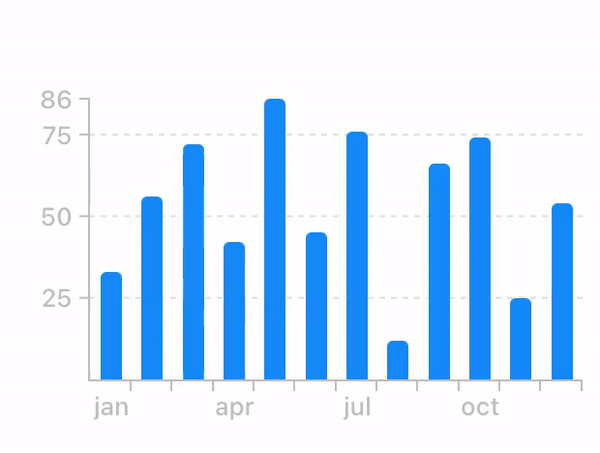
Highlight view
FLCharts allows you to display a view when tapping on a bar. The library has a default one but you can create your own creating a class that conforms to the protocol HighlightedView.
Here's an example:
Additional features
FLCharts has additional properties the allows you to further customize your charts.
You can assign your own configuration through the config property:
chart.config = FLChartConfig(granularityY: 20)
Aware x FLCharts
GitHub
Check out the library here.
Conclusion
For your time and attention! I hope you enjoyed this article and FLCharts.
If you have suggestions or feedbacks, they are really welcomed and they help me improve the library.
If you have any question about this article, feel free to email me or tweet me @franceleonidev and share your opinion.
Thank you for reading and see you in the next article!
Share this article